
Pre-reduction of Titanium Concentrate with Pulverized Coal and Iron Power Based on Response Surface Methodology Method
-
摘要:
这是一篇冶金工程领域的文章。开展了钛精矿粉共同添加煤粉和铁粉的单因素和响应曲面法加热还原实验,研究了温度、加热时间、铁粉添加量各因素不同水平对钛精矿中铁氧化物还原影响,构建了铁的金属化率3次回归模型,探究了各因素对铁的金属化率影响规律。单因素实验表明:铁粉添加量1.5% ~ 4.0%中,高于2.5%后,铁的金属化率能明显得到提高。响应曲面法实验结果分析发现:在对铁氧化物的还原影响程度中,温度>加热时间>铁粉添加量,温度与时间交互作用>加热时间与铁粉添加量的交互作用;1 450 ℃、33.5 min、4%铁粉添加量优化条件下,铁的金属化率可达86.79%,还原产品中金属铁明显呈现。
Abstract:This is an article in the field of metallurgical engineering. The single factor and response surface experiments of heating reduction of titanium concentrate powder adding pulverized coal and iron powder were carried out, respectively so as to study the effects of temperature, heating time and iron powder addition on iron oxide reduction in titanium concentrate. The three regression model of iron metallization rate was constructed, and the influence law of various influencing factors on iron metallization rate was explored. The single factor test shows that the iron metallization rate can be significantly improved above 2.5% in the range of 1.5% ~ 4.0% of the addition amount of iron powder. The response surface method experiment shows that temperature is the most important factor, followed by time and then amount of iron powder, and the interaction between temperature and time is greater than that between heating time and the amount of iron powder added in the degree of influence on the reduction of iron. The iron metallization rate can reach 86.79%, and metallic iron obviously appears in the reduced product at the optimized conditions of 1 450 ℃, 33.5 min and 4% of iron power addition.
-
我国拥有十分丰富的钒钛铁矿资源,钒钛磁铁矿经选取铁精矿后获得的钛精矿可用于制备生铁和钛渣[1-4]。制备钛渣中铁氧化物的还原以及与TiO2的分离过程中出现的工艺可以分为:还原与熔化同炉进行(以下简称为一步法)和先还原后熔化不同炉的两步进行(以下简称为二步法)的两大类工艺。由文献[5-11]分析发现,一步法工艺存在:熔融氧化铁的腐蚀性强,对炉衬损坏较大,极易降低炉衬使用寿命;碳还原氧化物产生大量的高CO含量煤气难以有效回收,能耗高等问题。二步法工艺,先在加热炉内将钛精矿进行预还原,然后加入终还原炉。在终还原炉内预还原的矿进一步进行还原后被熔化转变为钛渣和铁水。二步法中,终还原产生的炉气能被有效地用于还原粉料的预热,提高炉气热能利用,减轻环保问题。
二步法中用料方式包括有块料(如球团)和粉料,块料制备工艺相对较复杂、成本较高,国内外一些钛渣生产企业在钛精矿的铁氧化物预还原中选择使用粉料,但粉料中铁的预还原效果一般都较差,如何提高粉料中铁预还原效果的研究工作一直在进行。借鉴响应曲面法实验优势[12],本工作联合开展钛精矿-煤粉混合料的单因素、响应曲面法实验,以期获得优化参数及其较高的金属化率。实验原料中配入适量铁粉,以期在加热过程中能强化铁氧化物还原,提高铁的金属化率。
1. 原 料
实验用的钛精矿成分见表1,粒度为0.1~0.9 mm。煤粉成分见表2,粒度为0.001~1 mm。
表 1 钛精矿成分/%Table 1. Composition of titanium concentrateTFe TiO2 FeO Fe2O3 CaO MnO MgO SiO2 Al2O3 V2O5 其他 32.2 46.6 35.5 6.5 1.1 0.8 3.2 3.7 1.0 0.5 1.1 表 2 煤粉成分/%Table 2. Coal composition固定碳 灰分 挥发分 78.26 11.76 9.98 为减少加热过程中水分蒸发影响,实验时将钛精矿、煤粉等原料在120 ℃的温度下烘干6 h。
为促进钛精矿中铁氧化物的还原,考虑使用添加剂。一些研究[13-15]发现了Na2CO3、Li2CO3、NaCl、KCl、铁粉等添加物均具有改善铁氧化物的还原性。借鉴这些成果,为避免碱金属盐对钛精矿还原后将制备的钛渣产品性能产生影响,并考虑钛精矿还原中促进铁金属形成,本实验的原料中添加铁粉。
2. 实 验
2.1 实验方案
为使钛精矿-煤粉体系铁氧化物充分还原,按铁完全还原所需碳量的1.4倍进行配碳,即得到实验原料配比:钛精矿170 g,煤粉21 g。
为探索各因素对钛精矿中铁氧化物还原影响规律,设计了单因素实验方案(表3)。
表 3 单因素实验方案Table 3. Test program of single factors温度/℃ 时间/min 钛精矿的铁粉
添加比例 /%温度/℃ 时间/min 钛精矿的铁粉
添加比例 /%温度/℃ 时间/min 钛精矿的铁粉
添加比例 /%1 250 10 0 1 350 20 0 1 450 30 0 1 300 10 0 1 400 20 0 1 250 35 0 1 350 10 0 1 450 20 0 1 300 35 0 1 400 10 0 1 250 25 0 1 350 35 0 1 450 10 0 1 300 25 0 1 400 35 0 1 250 15 0 1 350 25 0 1 450 35 0 1 300 15 0 1 400 25 0 1 400 30 1.5 1 350 15 0 1 450 25 0 1400 30 2 1 400 15 0 1 250 30 0 1 400 30 2.5 1 450 15 0 1 300 30 0 1 400 30 3 1 250 20 0 1 350 30 0 1 400 30 3.5 1 300 20 0 1 400 30 0 1 400 30 4 在单因素实验基础上,根据响应曲面法设计原理,以铁的金属化率Y为响应值,采用Design Expert软件设计三因素三水平下的实验。实验的因素水平与编码见表4。
表 4 实验因数选取水平与编码值Table 4. Actual and code value of the variables水平 温度 时间 钛精矿的铁粉添加比例 实际/℃ 编号 实际/min 编号 实际/% 编号 T A t B M C 1 1 450 1 35 1 4 1 0 1 375 0 22.5 0 2 0 -1 1 300 -1 10 -1 0 -1 2.2 实验过程
实验前将钛精矿、煤粉按方案的配比配料、充分混匀。混匀料120 ℃下烘烤6 h,以去除其中水分。按配料方案称取干燥混合料放入SiC坩埚中,再置入温度已达到预设温度值的加热炉内加热。到预定时间后取出坩埚,并用N2冷却。最后对冷却样品进行金属铁和TFe含量(即铁元素含量)分析。以还原后试样中铁的金属化率Y(还原产生的金属铁量与还原后试样的TFe量之比值)作为钛精矿加热过程中铁氧化物还原程度评价指标。
3. 实验结果与分析
3.1 单因素实验结果与分析
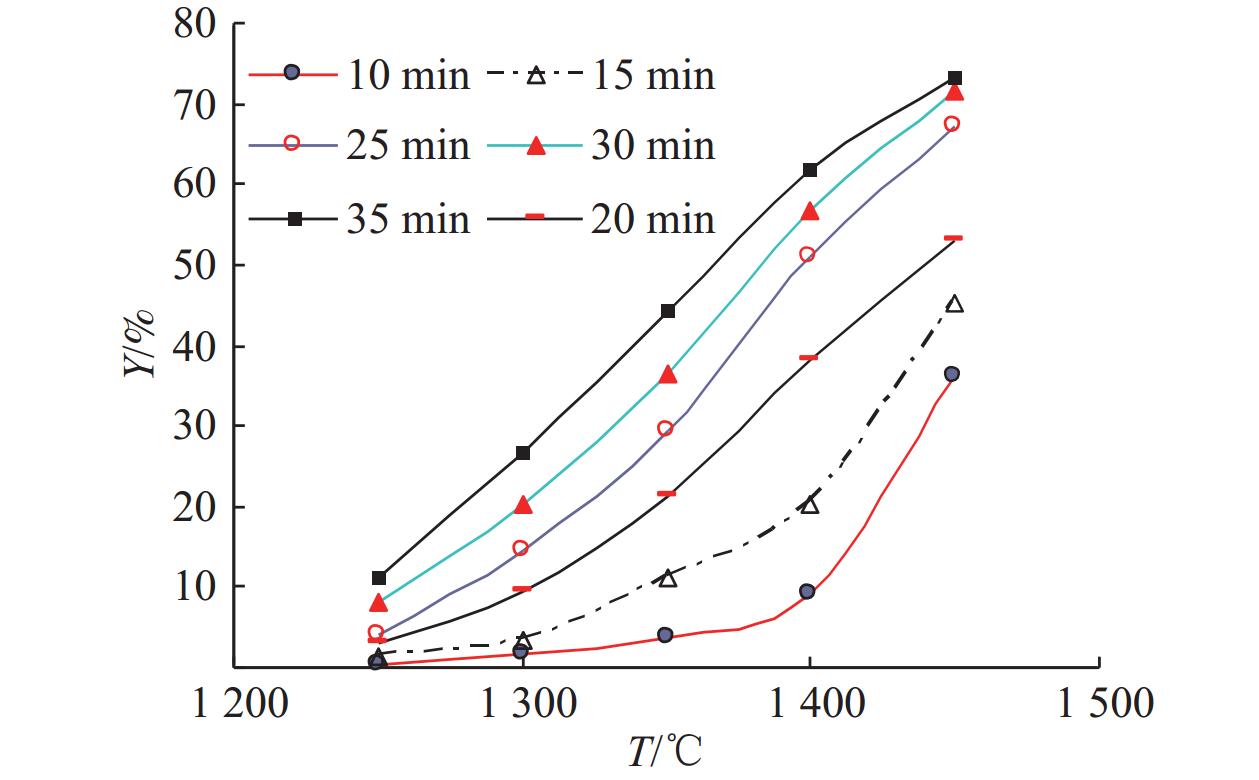
无添加铁粉条件下,钛精矿用煤粉加热还原得到的铁的金属化率与温度、时间关系见图1。由图1可见,随温度升高,铁的金属化率均逐渐增加,说明温度提高有利于钛精矿还原产生金属铁。这是由于实验所用钛精矿中主要物相为钛铁矿(FeTiO3),加热过程中反应为:FeTiO3 + C = Fe+TiO2+CO,采用HSC软件计算得到该反应ΔG1θ= -0.157 T + 198.1 kJ/mol,反应右向进行产生金属铁的热力学温度条件为 T≥987.83 ℃,且反应ΔH1θ=198.1 kJ/mol为吸热反应,温度提高有助于FeTiO3还原。根据阿累尼乌公式[16]可知,温度提高有利于加快还原反应速率,从而有利于钛精矿还原产生金属铁。
![]() 图 1 铁的金属化率与时间、温度关系Figure 1. Relationship between iron metallization, time and temperature
图 1 铁的金属化率与时间、温度关系Figure 1. Relationship between iron metallization, time and temperature比较图1中不同铁的金属化率线可见,加热温度提高到1 400 ℃才有较高的铁的金属化率;时间低于15 min、温度高于1 400 ℃时,随温度提高铁的金属化率明显提高;时间高于25 min、温度高于1 400 ℃时,随温度提高铁的金属化率提高缓慢。说明:钛精矿采用煤粉还原时,得到比较高的铁的金属化率温度需高于1 400 ℃;在高温(如1 450 ℃)下,加热时间35 min下试样的金属化率较10 min下试样的金属化率明显增加,但在25~35 min范围内,随加热时间增加,铁的金属化率增加较为缓慢。这是由于,钛铁矿还原反应在高温下加热时间较短时,试样中达到钛铁矿还原反应条件点位数较少,还原产生Fe量较少;随加热时间增加,通过炉料间的传热使试样中达到钛铁矿还原反应温度条件的点位数快速增加,还原产生Fe量明显增加;当时间再增加,已经历一段时期的还原反应,试样中剩余钛铁矿可参与还原反应的点位数较少,从而使钛铁矿还原产生的Fe量相对较少[16]。
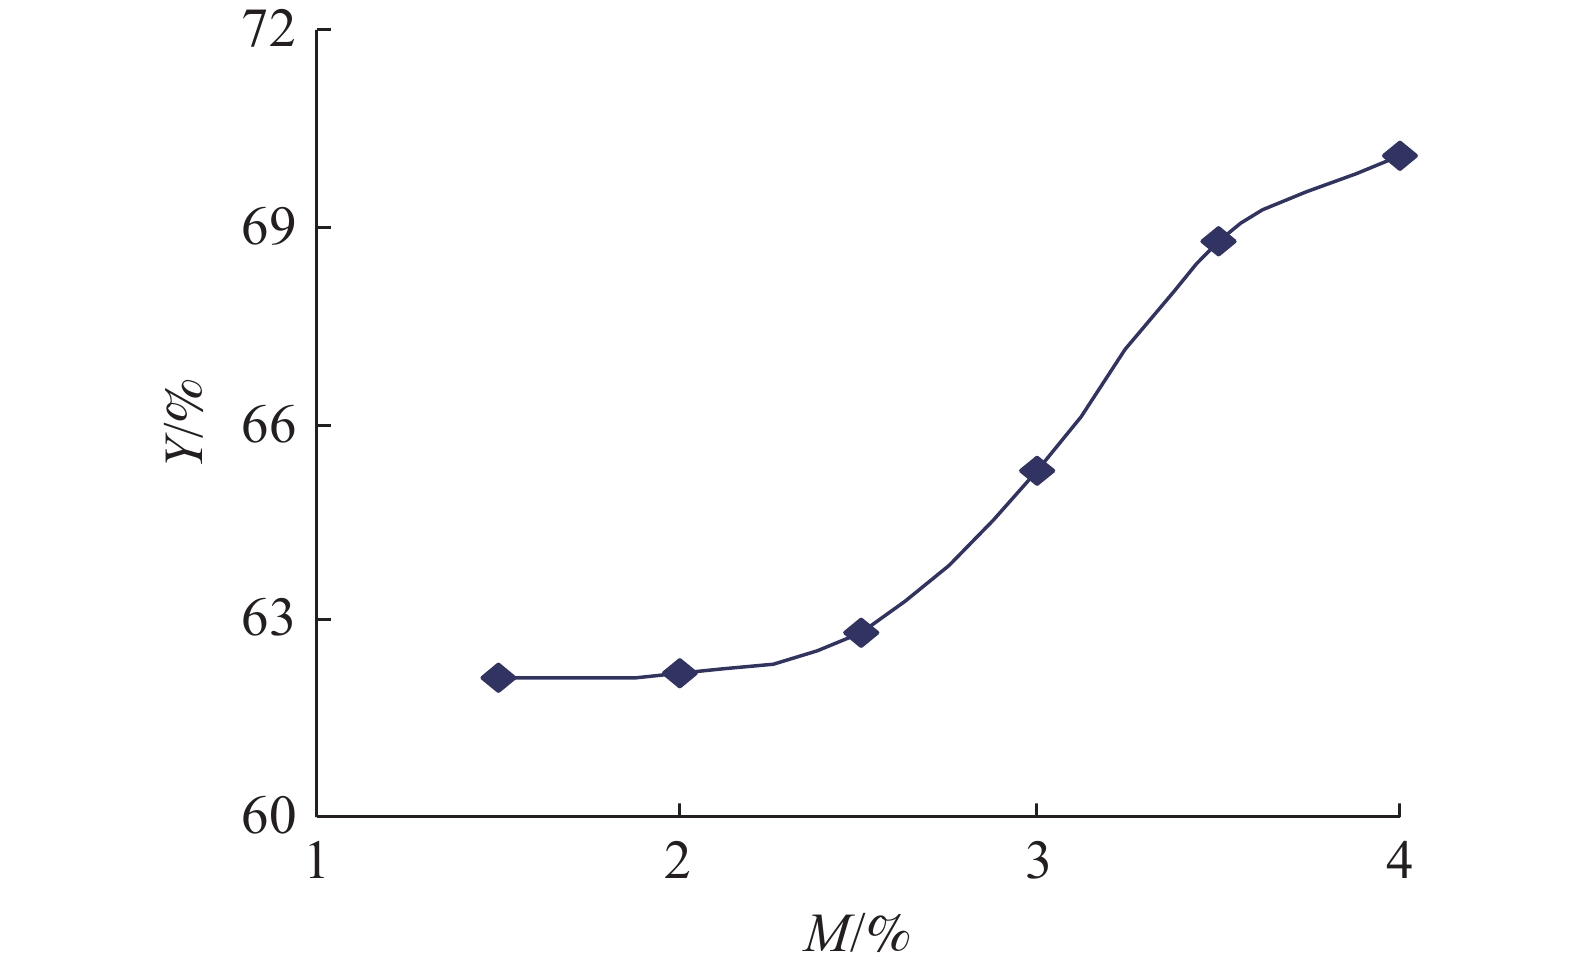
钛精矿中添加铁粉进行煤粉还原的实验结果见图2。由图2可见,1 400 ℃、30 min、铁粉添加量1.5%~4.0%条件下,钛精矿还原中铁的金属化率由62%增加到70.1%;随铁粉添加量增加,铁的金属化率增加,同时铁粉添加量低于2.5%时,铁的金属化率增加幅度小,铁粉添加量高于2.5%时,铁的金属化率增加幅度较大。说明,铁粉添加量高于2.5%可强化铁氧化物的还原。
![]() 图 2 1 400 ℃下铁的金属化率与金属铁粉添加量关系Figure 2. Relationship between iron metallization and iron powder addition at 1 400 ℃
图 2 1 400 ℃下铁的金属化率与金属铁粉添加量关系Figure 2. Relationship between iron metallization and iron powder addition at 1 400 ℃3.2 响应曲面法实验结果与分析
响应曲面法实验方案及其实验结果见表5。
表 5 响应面法实验结果Table 5. Program and results of RSM testA B C Y /% A B C Y /% A B C Y /% A B C Y /% A B C Y /% 1 -1 0 17.1 0 1 -1 53.2 1 0 -1 64.4 -1 0 1 22.4 1 1 0 75.3 0 1 1 64.3 0 0 0 43.3 -1 1 0 42.2 0 0 0 49.3 - - - - -1 -1 0 8.8 0 0 0 43.2 1 0 1 73.4 0 0 0 42.2 - - - - -1 0 -1 17.5 0 -1 -1 31.5 0 0 0 45.5 0 -1 1 24.5 - - - - (1)方差分析
通过Design Expert 8.0.6软件对实验结果施行三次多元回归拟合,在显著性水平α=0.05条件下对表6中数据方差分析,结果见表6。
表 6 未手动处理的方差分析Table 6. ANOVA without manual operation来源 平方和 df 均方 F 值 P 值 显著程度 模型 6 378 12 531.5 65.9 0.000 5 * A 2 396.1 1 2 396.1 297.1 < 0.000 1 ** B 945.56 1 945.56 117.24 0.000 4 * C 4.2 1 4.2 0.52 0.510 3 AB 153.76 1 153.76 19.07 0.012 * AC 4.2 1 4.2 0.52 0.510 3 BC 81.9 1 81.9 10.16 0.033 3 * A2 64.04 1 64.04 7.94 0.047 9 * B2 103.17 1 103.17 12.79 0.023 2 * C2 55.33 1 55.33 6.86 0.058 8 A2B 113.25 1 113.25 14.04 0.02 * A2C 12.01 1 12.01 1.49 0.289 5 AB2 399.03 1 399.03 49.48 0.002 2 * Pure Error 32.26 4 8.06 Cor Total 6 410.26 16 注:P≤0.000 1,为非常显著,用**表示;P≤0.05,为显著,用*表示;P>0.05,为不显著。 由表6可见,模型的P=0.000 5<0.05,表明拟合模型显著;A项P< 0.000 1,表明温度对Y影响非常显著;B、AB、BC、A2、B2、 A2B、AB2等项目的P均小于0.05,表明这些项对Y的影响显著;C、AC、C2、A2C等项目的P值均大于0.05,表明C、AC、C2、A2C等项目对Y的影响不显著。
(2)响应值回归模型的优化
使用软件对Y影响不显著项进行手动优化,结果见表7。手动优化后得到响应值Y与各影响因素之间的3次回归模型为:
表 7 手动处理的方差分析Table 7. ANOVA analysis with manual operation来源 平方和 df 均方 F 值 P 值 显著程度 模型 6 369.6 10 636.96 93.98 < 0.000 1 ** A 2 396.1 1 2 396.1 353.54 < 0.000 1 ** B 945.56 1 945.56 139.51 < 0.000 1 ** AB 153.76 1 153.76 22.69 0.003 1 * BC 81.9 1 81.9 12.08 0.013 2 * A2 64.04 1 64.04 9.45 0.021 8 * B2 103.17 1 103.17 15.22 0.008 * C2 55.33 1 55.33 8.16 0.028 9 * A2B 113.25 1 113.25 16.71 0.006 4 * A2C 48.3 1 48.3 7.13 0.037 * AB2 399.03 1 399.03 58.88 0.000 3 * Residual 40.66 6 6.78 Lack of Fit 8.41 2 4.2 0.52 0.629 3 not significant Pure Error 32.26 4 8.06 Cor Total 6 410.26 16 注:P≤0.000 1,为非常显著,用**表示;P≤0.05,为显著,用*表示;P>0.05,为不显著。 Y=44.70+24.48A+15.38B+6.20AB+4.52BC-3.90A2-4.95B2+3.62C2+7.53A2B+3.48A2C-14.13AB2
由上式中各项系数可知,温度和时间因数、对Y(铁的金属化率)有显著正的影响,且对Y影响重要程度为:A(温度)>B(时间)>C(铁粉添加量),AB(温度与加热时间交互作用)>BC(加热时间与铁粉添加量的交互作用)。
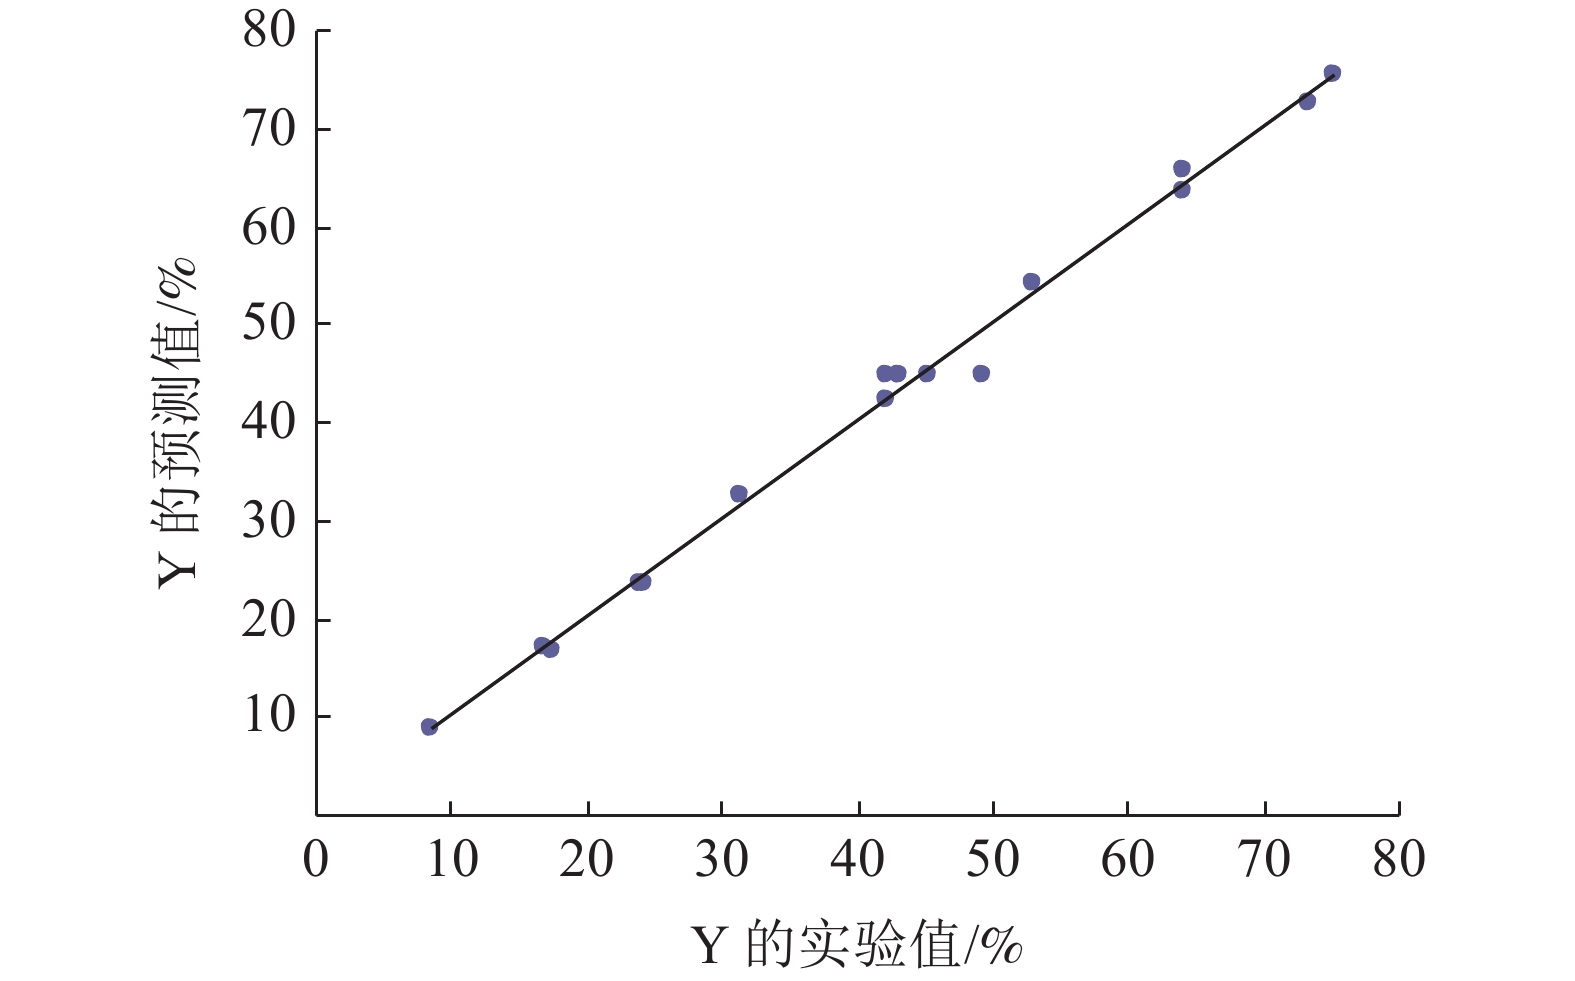
由表7可见,方差分析得到的失拟项的P=0.629 3>0.05、模型的P<0.000 1,失拟项不显著,模型非常显著,表明建立的模型数据可行。绘制由模型预测的Y与实验Y值之间关系(见图3),两者的相关系数R为0.997。可见,模型预测Y值与实验Y值拟合程度良好,建立的模型可用于对钛精矿-煤基体系加热中铁还原进行分析与预测。
![]() 图 3 模型预测的Y与实验值Y之间关系Figure 3. Relationship between predicted value of Y by the model and test value of Y
图 3 模型预测的Y与实验值Y之间关系Figure 3. Relationship between predicted value of Y by the model and test value of Y(3)铁氧化物还原优化的预测与验证
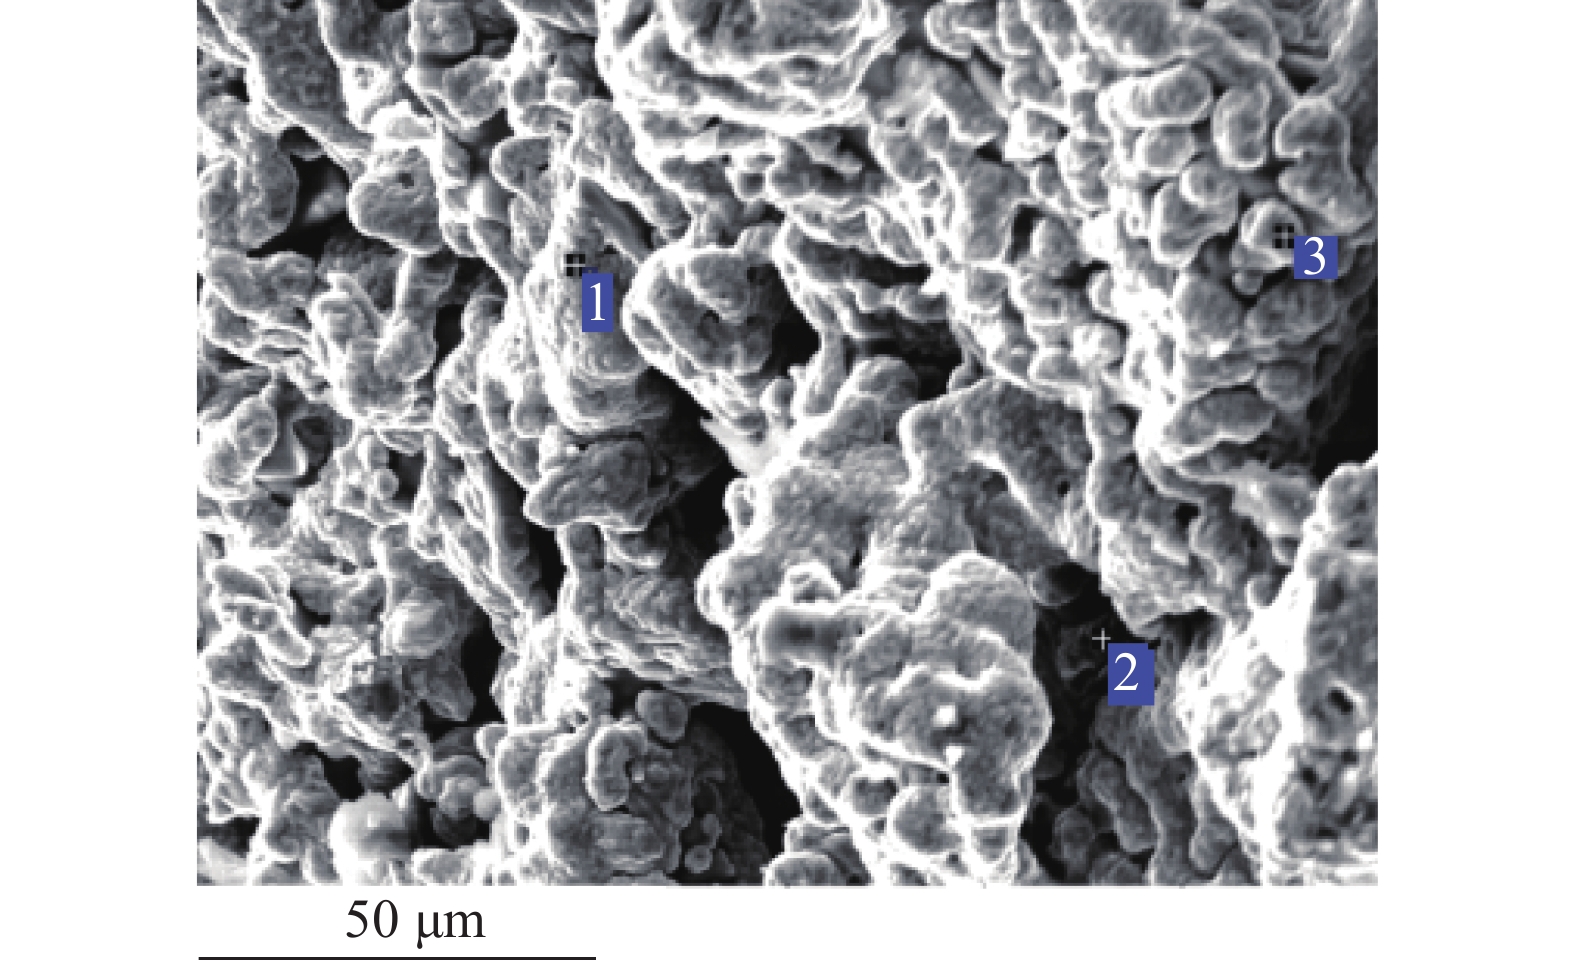
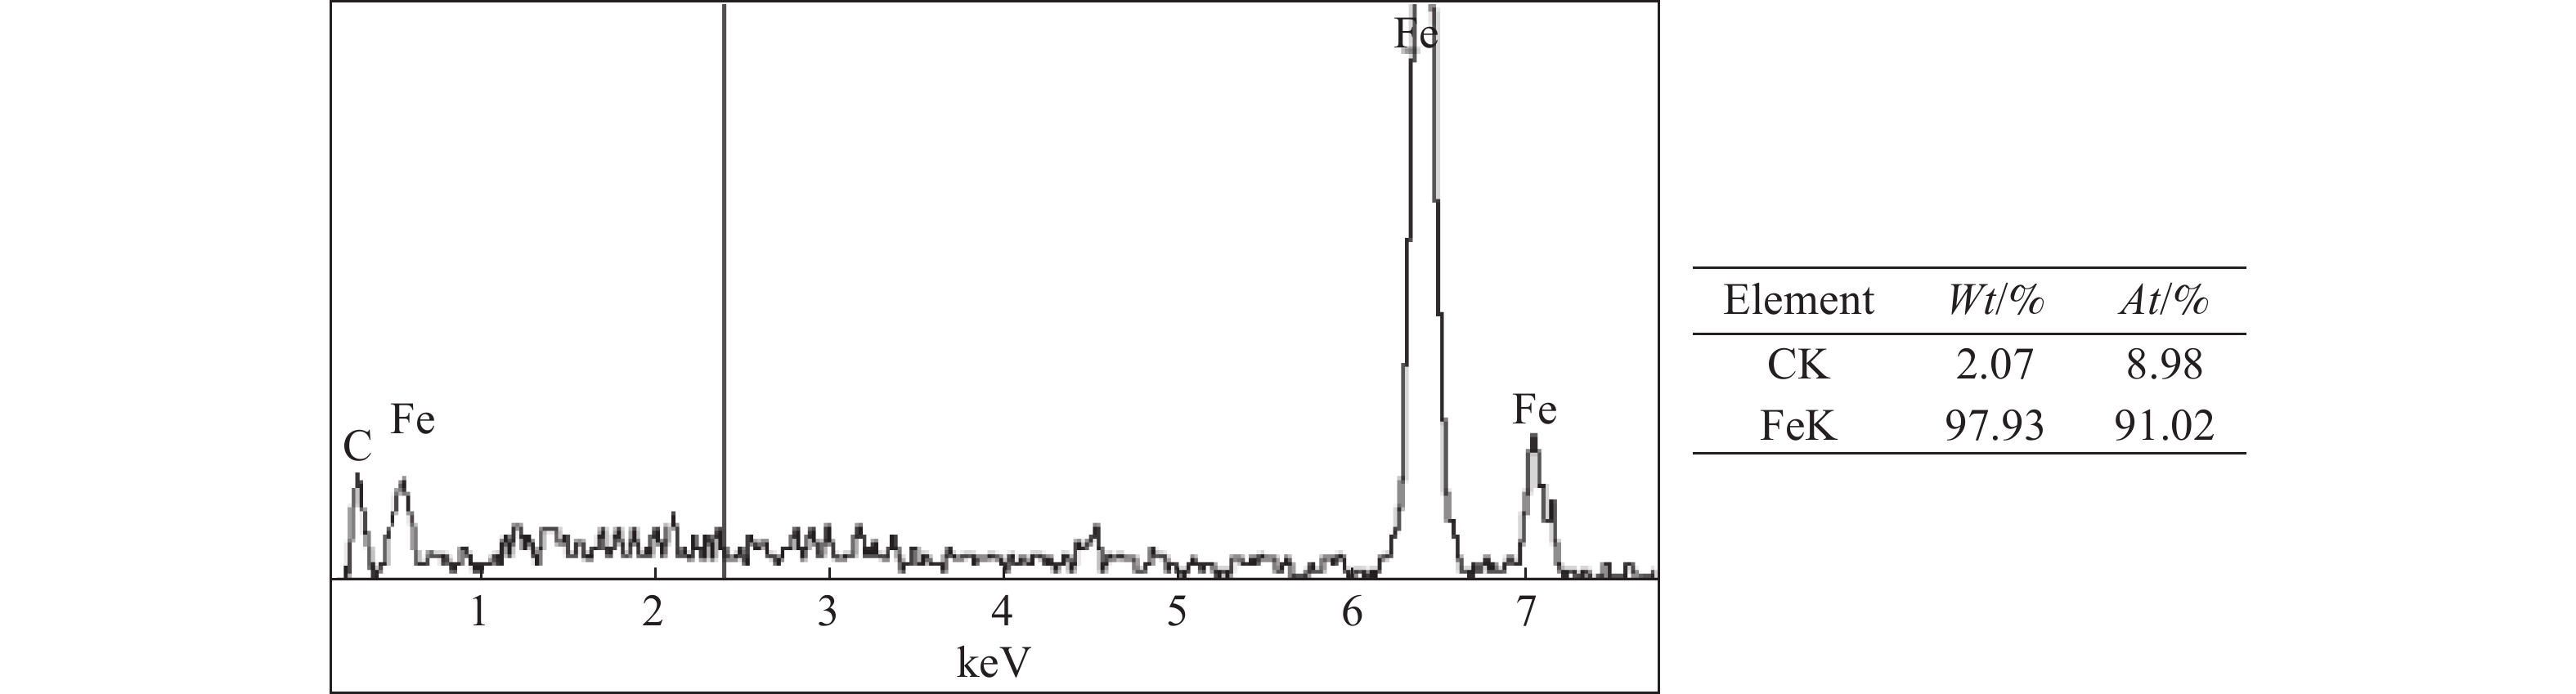
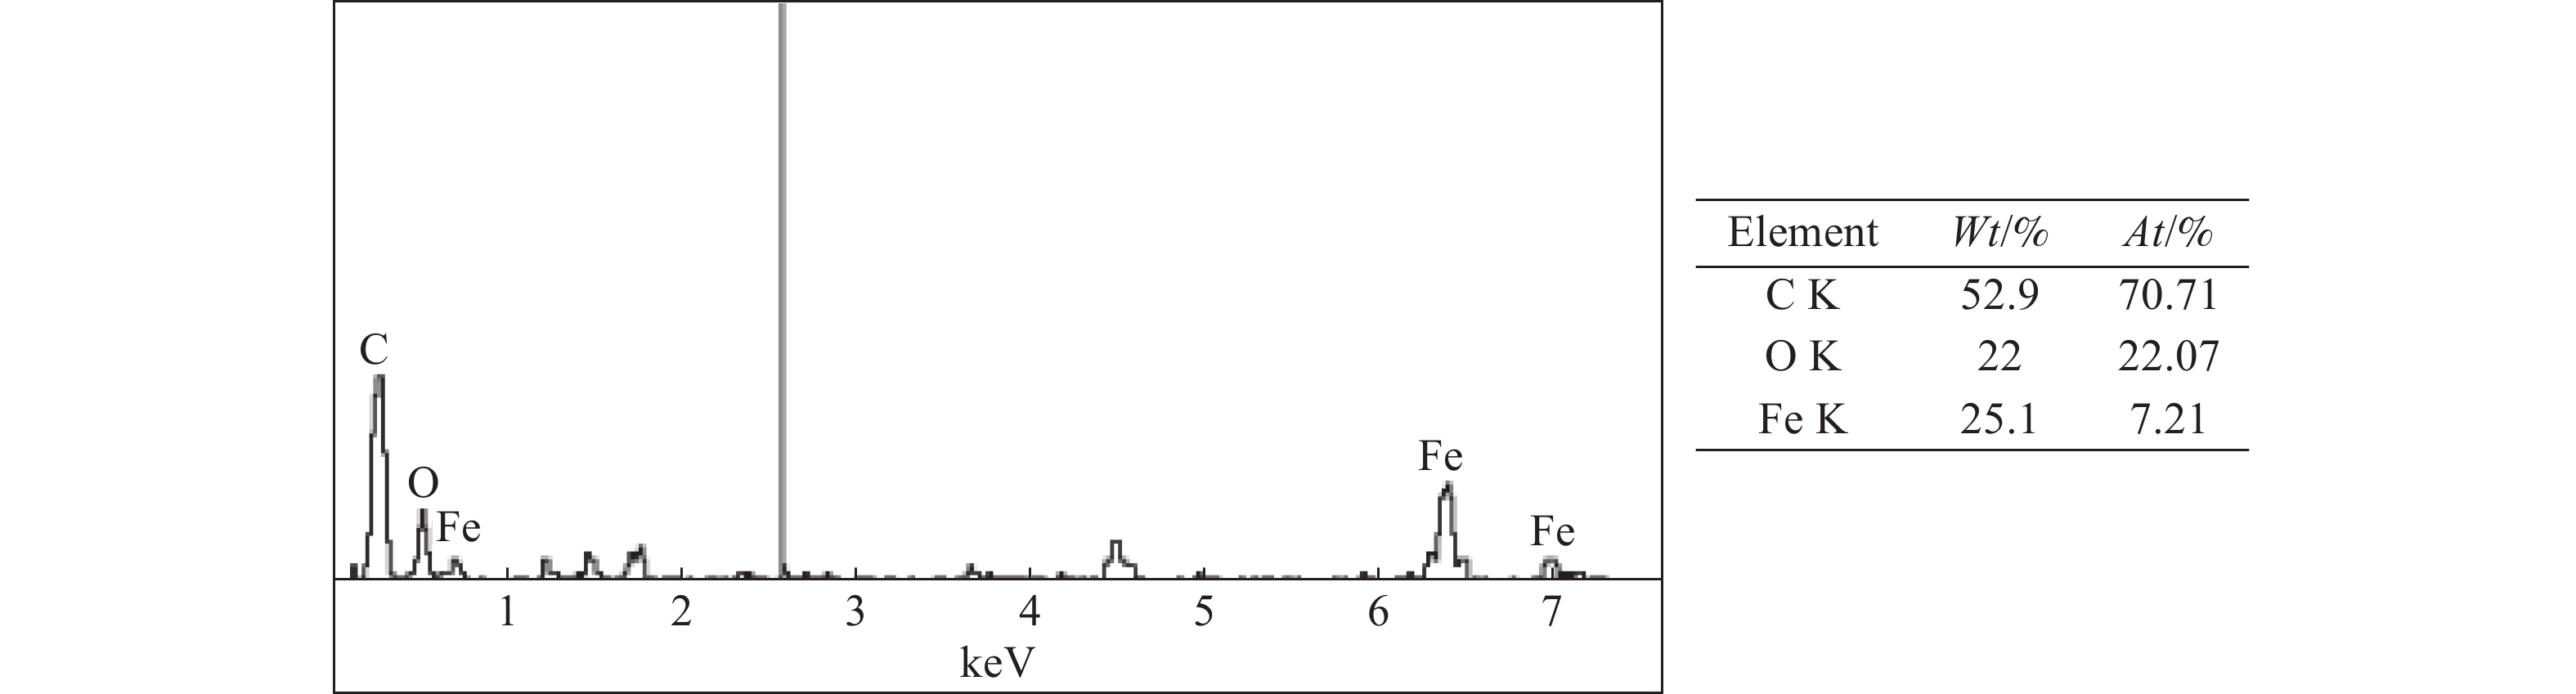
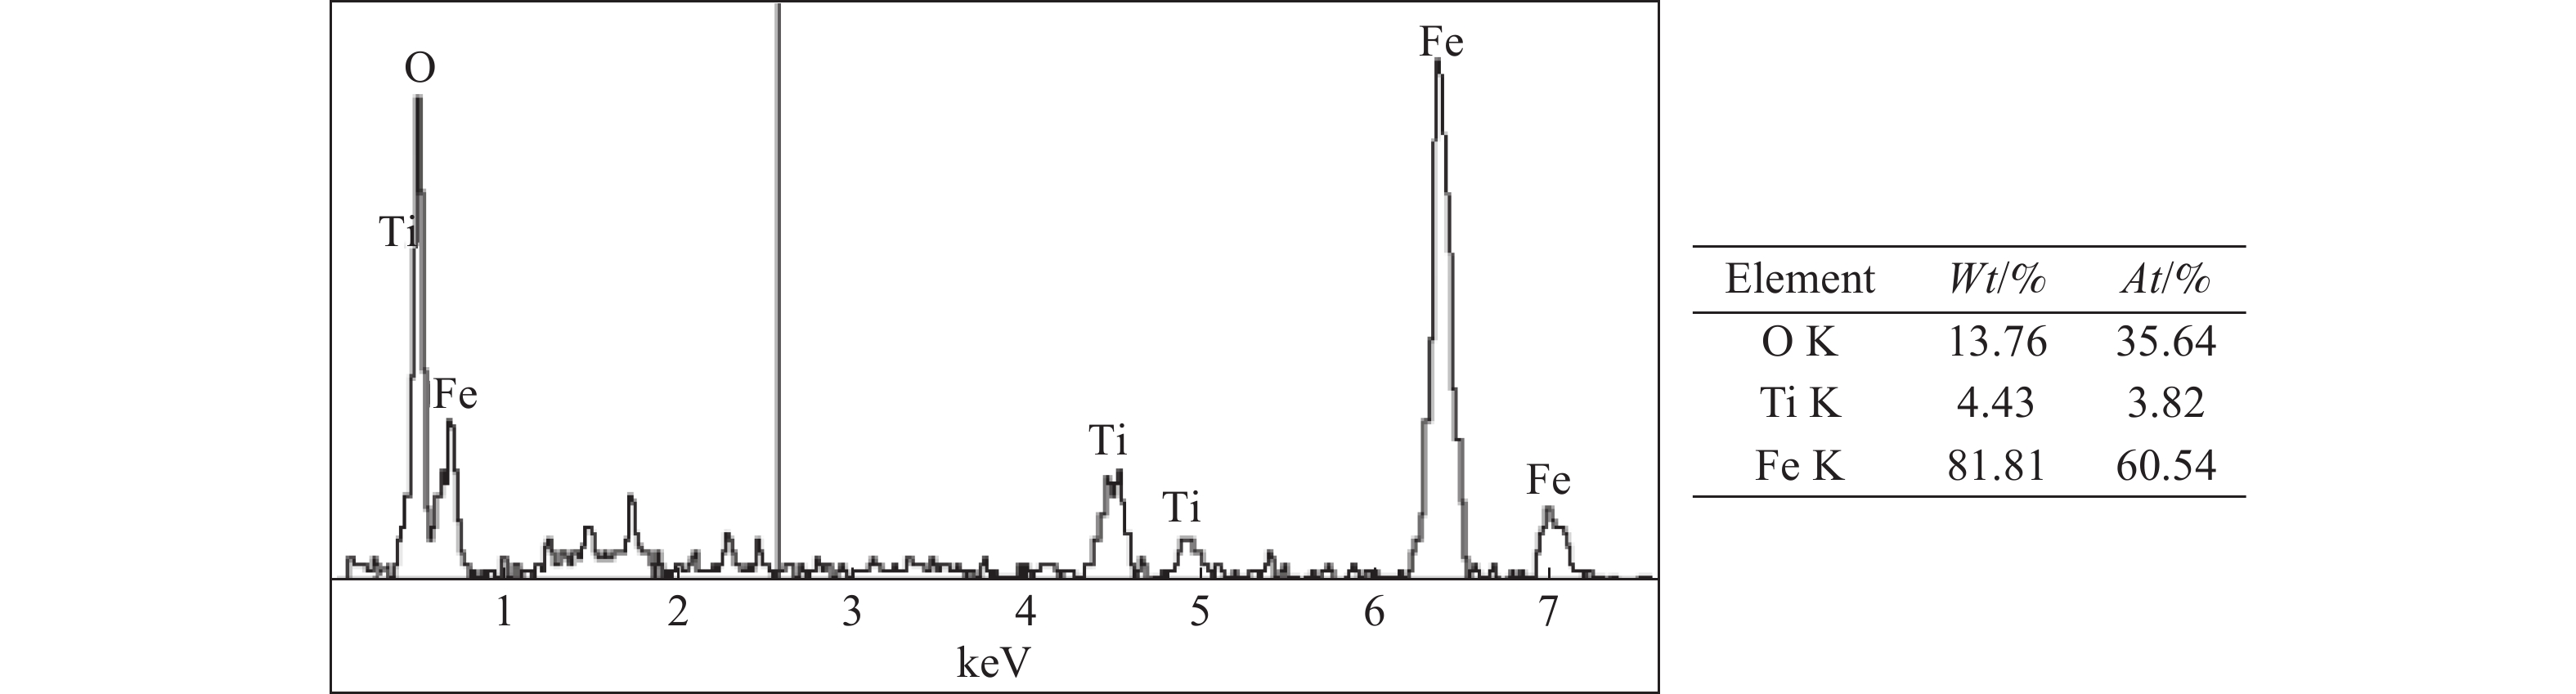
由软件对回归方程(1)优化求解,得到铁氧化物还原较佳条件为:温度1 450 ℃、时间33.5 min、铁粉添加量4%,响应Y值最大为87.2%。按较佳条件进行三次实验,得到铁金属化率分别为87.10%、86.46%、86.82%,平均为86.79%,与预测响应Y值误差小,表明经手动回归的模型(1)是可靠的。取本次实验中一个产品进行电镜扫描,结果见图4~7。分析图4可见,还原产品主要由白色区域组成,其次为灰白色区域,还有很少量灰黑色区域以及黑色区域。图5~7能谱分析可知,白色区域以Fe为主,还包含极少量的C;灰白色区域边缘为Fe,内部为钛、铁氧化物组成的固溶体,钛、铁氧化物包裹于内核中;灰黑色区域主要由C组成。结果表明,在优化实验条件下,金属铁明显出现于钛精矿-煤粉体系还原产物中。
![]() 图 4 钛精矿-煤粉体系1 450 ℃下加热33.5 min产物的SEMFigure 4. SEM of ilmenite concentrate-coalsystem heated in 33.5 min at 1 450 ℃
图 4 钛精矿-煤粉体系1 450 ℃下加热33.5 min产物的SEMFigure 4. SEM of ilmenite concentrate-coalsystem heated in 33.5 min at 1 450 ℃4. 结 论
(1)加热时间高于15 min、温度低于1 400 ℃条件下,随加热时间增加,铁的金属化率增加缓慢;高于1 400℃条件下,随加热时间增加,铁的金属化率增加非常显著;1 400 ℃、30 min、1.5%~4.0%铁粉添加量条件下,钛精矿还原中铁的金属化率由62%增加到70.1%;铁粉添加量高于2.5%后,铁的金属化率明显提高。
(2)在钛精矿-煤体系加热过程中,温度、时间、温度与时间交互作用以及铁添加量交互作用对铁氧化物还原的金属化率有显著正的影响,其影响程度中,温度>加热时间>铁粉添加量,温度与加热时间的交互作用>加热时间与铁粉添加量交互作用。
(3)建立的铁金属化率与因素间回归模型具有良好拟合度和可靠性,并由此得到1 450 ℃、33.5 min、4%铁粉添加量优化条件;由优化条件开展实验得到精矿-煤基体系加热过程中铁氧化物还原的金属化率最高可达86.79%,且还原产品中金属铁明显存在。
-
![]()
图 1 铁的金属化率与时间、温度关系
Figure 1. Relationship between iron metallization, time and temperature
![]()
图 2 1 400 ℃下铁的金属化率与金属铁粉添加量关系
Figure 2. Relationship between iron metallization and iron powder addition at 1 400 ℃
![]()
图 3 模型预测的Y与实验值Y之间关系
Figure 3. Relationship between predicted value of Y by the model and test value of Y
![]()
图 4 钛精矿-煤粉体系1 450 ℃下加热33.5 min产物的SEM
Figure 4. SEM of ilmenite concentrate-coalsystem heated in 33.5 min at 1 450 ℃
表 1 钛精矿成分/%
Table 1 Composition of titanium concentrate
TFe TiO2 FeO Fe2O3 CaO MnO MgO SiO2 Al2O3 V2O5 其他 32.2 46.6 35.5 6.5 1.1 0.8 3.2 3.7 1.0 0.5 1.1  下载: 导出CSV
表 3 单因素实验方案
Table 3 Test program of single factors
温度/℃ 时间/min 钛精矿的铁粉
添加比例 /%温度/℃ 时间/min 钛精矿的铁粉
添加比例 /%温度/℃ 时间/min 钛精矿的铁粉
添加比例 /%1 250 10 0 1 350 20 0 1 450 30 0 1 300 10 0 1 400 20 0 1 250 35 0 1 350 10 0 1 450 20 0 1 300 35 0 1 400 10 0 1 250 25 0 1 350 35 0 1 450 10 0 1 300 25 0 1 400 35 0 1 250 15 0 1 350 25 0 1 450 35 0 1 300 15 0 1 400 25 0 1 400 30 1.5 1 350 15 0 1 450 25 0 1400 30 2 1 400 15 0 1 250 30 0 1 400 30 2.5 1 450 15 0 1 300 30 0 1 400 30 3 1 250 20 0 1 350 30 0 1 400 30 3.5 1 300 20 0 1 400 30 0 1 400 30 4
下载: 导出CSV
表 4 实验因数选取水平与编码值
Table 4 Actual and code value of the variables
水平 温度 时间 钛精矿的铁粉添加比例 实际/℃ 编号 实际/min 编号 实际/% 编号 T A t B M C 1 1 450 1 35 1 4 1 0 1 375 0 22.5 0 2 0 -1 1 300 -1 10 -1 0 -1
下载: 导出CSV
表 5 响应面法实验结果
Table 5 Program and results of RSM test
A B C Y /% A B C Y /% A B C Y /% A B C Y /% A B C Y /% 1 -1 0 17.1 0 1 -1 53.2 1 0 -1 64.4 -1 0 1 22.4 1 1 0 75.3 0 1 1 64.3 0 0 0 43.3 -1 1 0 42.2 0 0 0 49.3 - - - - -1 -1 0 8.8 0 0 0 43.2 1 0 1 73.4 0 0 0 42.2 - - - - -1 0 -1 17.5 0 -1 -1 31.5 0 0 0 45.5 0 -1 1 24.5 - - - -
下载: 导出CSV
表 6 未手动处理的方差分析
Table 6 ANOVA without manual operation
来源 平方和 df 均方 F 值 P 值 显著程度 模型 6 378 12 531.5 65.9 0.000 5 * A 2 396.1 1 2 396.1 297.1 < 0.000 1 ** B 945.56 1 945.56 117.24 0.000 4 * C 4.2 1 4.2 0.52 0.510 3 AB 153.76 1 153.76 19.07 0.012 * AC 4.2 1 4.2 0.52 0.510 3 BC 81.9 1 81.9 10.16 0.033 3 * A2 64.04 1 64.04 7.94 0.047 9 * B2 103.17 1 103.17 12.79 0.023 2 * C2 55.33 1 55.33 6.86 0.058 8 A2B 113.25 1 113.25 14.04 0.02 * A2C 12.01 1 12.01 1.49 0.289 5 AB2 399.03 1 399.03 49.48 0.002 2 * Pure Error 32.26 4 8.06 Cor Total 6 410.26 16 注:P≤0.000 1,为非常显著,用**表示;P≤0.05,为显著,用*表示;P>0.05,为不显著。
下载: 导出CSV
表 7 手动处理的方差分析
Table 7 ANOVA analysis with manual operation
来源 平方和 df 均方 F 值 P 值 显著程度 模型 6 369.6 10 636.96 93.98 < 0.000 1 ** A 2 396.1 1 2 396.1 353.54 < 0.000 1 ** B 945.56 1 945.56 139.51 < 0.000 1 ** AB 153.76 1 153.76 22.69 0.003 1 * BC 81.9 1 81.9 12.08 0.013 2 * A2 64.04 1 64.04 9.45 0.021 8 * B2 103.17 1 103.17 15.22 0.008 * C2 55.33 1 55.33 8.16 0.028 9 * A2B 113.25 1 113.25 16.71 0.006 4 * A2C 48.3 1 48.3 7.13 0.037 * AB2 399.03 1 399.03 58.88 0.000 3 * Residual 40.66 6 6.78 Lack of Fit 8.41 2 4.2 0.52 0.629 3 not significant Pure Error 32.26 4 8.06 Cor Total 6 410.26 16 注:P≤0.000 1,为非常显著,用**表示;P≤0.05,为显著,用*表示;P>0.05,为不显著。
下载: 导出CSV
-
[1] 刘立伟, 赵礼兵, 李国峰, 等. 某钒钛磁铁精矿深度还原-磁选试验研究[J]. 矿产综合利用, 2020(6): 56-63.LIU L W , ZHAO L B , LI G F, et al. Study on coal-based reduction followed by magnetic separation of a vanadium-titanium magnetite concentrate[J]. Multipurpose Utilization of Mineral, 2020(6): 56-63. LIU L W , ZHAO L B , LI G F, et al. Study on coal-based reduction followed by magnetic separation of a vanadium-titanium magnetite concentrate[J]. Multipurpose Utilization of Mineral, 2020(6): 56-63.
[2] 范兴祥, 余宇楠, 袁威, 等. 利用云南钛铁精矿制备还原铁粉及富钛料的试验研究[J]. 矿产综合利用, 2018(2):52-56.FAN X X, YU Y N, YUAN W, et al. Experimental research on preparation of reduced iron powder and rich titanium materials from Yunnan titanium ore concentrate[J]. Multipurpose Utilization of Mineral, 2018(2):52-56. FAN X X, YU Y N, YUAN W, et al. Experimental research on preparation of reduced iron powder and rich titanium materials from Yunnan titanium ore concentrate[J]. Multipurpose Utilization of Mineral, 2018(2):52-56.
[3] 付贵勤, 薛逊, 汪锋, 等. 钒钛酸性渣还原过程中钒钛赋存状态的研究[J]. 矿产资源综合利用, 2009(2):40-44.FU G Q, XUE X, WANG F, et al. Study on the occurrence of Ti during reduction process of the acidic vanadium -titanium[J]. Multipurpose Utilization of Mineral, 2009(2):40-44. FU G Q, XUE X, WANG F, et al. Study on the occurrence of Ti during reduction process of the acidic vanadium -titanium[J]. Multipurpose Utilization of Mineral, 2009(2):40-44.
[4] 张世敏, 黄孟阳, 彭金辉, 等. 微波还原越南钛精矿制备初级富钛料新工艺研究[J]. 矿产资源综合利用, 2007(3):17-20.ZHANG S M, HUANG M Y, PENG J H, et al. Study on preparing primary titanium materials from self-reduced pellet 0f vietnam ilmenite concentrate by microwave reduction[J]. Multipurpose Utilization of Mineral, 2007(3):17-20. ZHANG S M, HUANG M Y, PENG J H, et al. Study on preparing primary titanium materials from self-reduced pellet 0f vietnam ilmenite concentrate by microwave reduction[J]. Multipurpose Utilization of Mineral, 2007(3):17-20.
[5] 刘云龙, 郭培民, 庞建明, 等. 高杂质钛铁矿固态催化还原动力学研究[J]. 钢铁钒钛, 2013, 34(6):1-5.LIU Y L, GUO P M, PANG J M, et al. Kinetics study on solid-phase catalytic reduction of highly impure ilmenite by thermal analysis[J]. Iron Steel Vanadium Titanium, 2013, 34(6):1-5. LIU Y L, GUO P M, PANG J M, et al. Kinetics study on solid-phase catalytic reduction of highly impure ilmenite by thermal analysis[J]. Iron Steel Vanadium Titanium, 2013, 34(6):1-5.
[6] Y. Zhao, F. Shadman. Kinetics and mechanism of ilmenite reduction with carbon monoxide[J]. AICHE Journal, 1990, 36(9):1433-1438. doi: 10.1002/aic.690360917
[7] J. Pesl, R. H. Eric. High temperature carbothermic reduction of Fe2O3-TiO2-MxOy oxide mixtures[J]. Minerals Engineering, 2002(15):971-984.
[8] WANG Yu-ming, YUAN Zhang-fu, GUO Zhan-cheng, et al. Reduction mechanism of natural ilmenite with graphite[J]. Tansaction. Nonferrous Metals Society of China, 2008, 180:962-968.
[9] C. S. Kucukkaragoz, R. H. Eric. Solid state reduction of a nature ilmenite[J]. Miners Engineering, 2006, 19:334-337. doi: 10.1016/j.mineng.2005.09.015
[10] Hai-peng GOU, Guo-hua ZHANG, Xiao-jun HU, et al. Kinetic study on carbothermicreduction of ilmenite with activated carbon[J]. Transactions of Nonferrous Metals Society of China, 2017, 27(8):1856-1861. doi: 10.1016/S1003-6326(17)60209-7
[11] 韩可喜. 钛精矿预还原球团冶炼钛渣的电耗水平分析[J]. 钢铁钒钛, 2014, 35(2):51-55.HAN K X. Analysis on electricity consumption for titanium slag smelting with pre-reduced concentrate pellets[J]. Iron Steel Vanadium Titanium, 2014, 35(2):51-55. HAN K X. Analysis on electricity consumption for titanium slag smelting with pre-reduced concentrate pellets[J]. Iron Steel Vanadium Titanium, 2014, 35(2):51-55.
[12] 信晓飞, 张晋霞, 冯洪均. 响应曲面法优化含锌尘泥选择性浸出工艺[J]. 矿产综合利用, 2021(2):146-151.XIN X F, ZHANG J X, FENG H J. Optimization of selective leaching technology from zinc-bearing dust using response surface methodology[J]. Multipurpose Utilization of Mineral, 2021(2):146-151. XIN X F, ZHANG J X, FENG H J. Optimization of selective leaching technology from zinc-bearing dust using response surface methodology[J]. Multipurpose Utilization of Mineral, 2021(2):146-151.
[13] 吕学伟, 张凯, 黄润, 等. 添加剂对钛精矿固相碳热还原强化作用的比较[J]. 东北大学学报(自然科学版), 2013, 34(11):1601-1605.LU X W, ZHANG K, HUANG R. Comparison of the effects of different additives on the solid phase carbon thermal reduction of ilmenite[J]. Journal of Northeastern University(Natural Science), 2013, 34(11):1601-1605. LU X W, ZHANG K, HUANG R. Comparison of the effects of different additives on the solid phase carbon thermal reduction of ilmenite[J]. Journal of Northeastern University(Natural Science), 2013, 34(11):1601-1605.
[14] 郭兴敏, 唐洪福, 张圣弼. Li2CO3在含碳球团中催化机理的研究[J]. 金属学报, 2000, 36(6):638-641.GUO X M, TANG H F, ZHANG S B. Study on the catalysis mechanism of Li2CO3 for reduction of iron ore pellet with carbon[J]. Acta Metellurgical Sinica, 2000, 36(6):638-641. GUO X M, TANG H F, ZHANG S B. Study on the catalysis mechanism of Li2CO3 for reduction of iron ore pellet with carbon[J]. Acta Metellurgical Sinica, 2000, 36(6):638-641.
[15] 刘牡丹, 姜涛, 李光辉. 硫酸钠和碳酸钠对高铝铁矿钠化还原动力学规律的影响[J]. 中国有色金属学报, 2015, 25(1):220-226.LIU M D, JIANG T, LI G H. Effects of Na2SO4 and Na2CO3 on sodium-reduction dynamics law of high aluminum iron ores[J]. The Chinese Journal of Nonferrous Metals, 2015, 25(1):220-226. LIU M D, JIANG T, LI G H. Effects of Na2SO4 and Na2CO3 on sodium-reduction dynamics law of high aluminum iron ores[J]. The Chinese Journal of Nonferrous Metals, 2015, 25(1):220-226.
[16] 黄希祜. 钢铁冶金原理[M]. 北京: 冶金工业出版社, 2013.HUANG X G. Principles of iron and steel metallurgy [M]. Beijing: Metallurgical Industry Press, 2013. HUANG X G. Principles of iron and steel metallurgy [M]. Beijing: Metallurgical Industry Press, 2013.
计量
- 文章访问数: 20
- HTML全文浏览量: 5
- PDF下载量: 2

